Introduction
Throughout the pages of this site, you will find lots of information pertaining to infographics; what they are, the different types, a list of tools used to create them, and many tutorials to get you started.
Is a Picture is Worth a Thousand Words? Or More?
"The adage 'A picture is worth a thousand words' refers to the notion that a complex idea can be conveyed with just a single still image. It also aptly characterizes one of the main goals of visualization, namely making it possible to absorb large amounts of data quickly." (Wikipedia) Therefore, " Pictures convey information more efficiently and effectively than words do." (McGraw-Hill Dictionary of American Idioms and Phrasal Verbs, 2002)
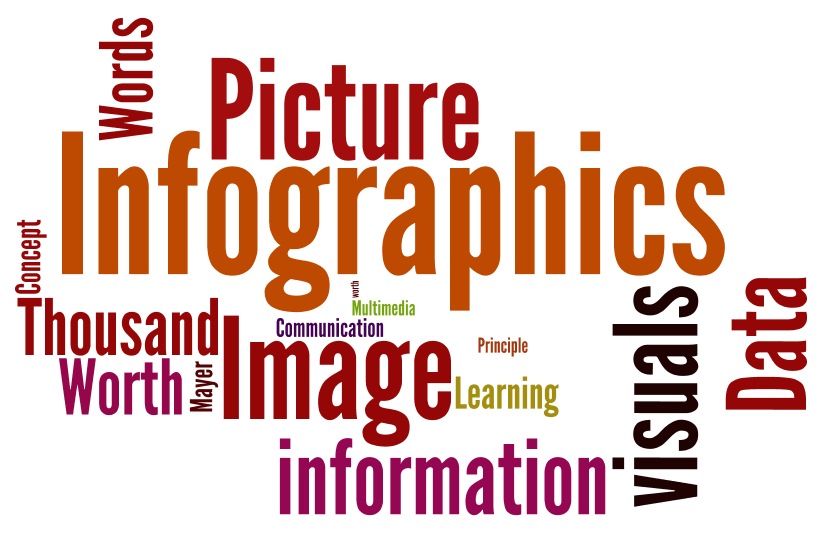
In this case, the image shown below is worth more than a thousand words! Why? Because not only is this particular image made up of exactly a thousand (1000) words, it represents much more than just the thousand words it is made up of. It is an infographic, created using Wordle, in that the words used most often are shown in larger text. The bigger the word, the more times it was used throughout the text provided to create it.
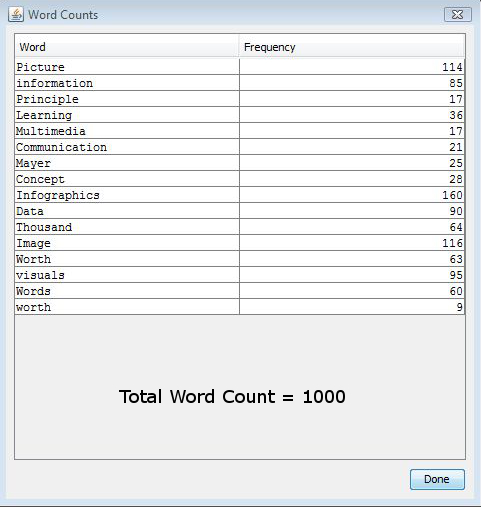
The following image depicts the number of words used to create the above image, as well as how many times each word was used.
What is an infographic?
"An infographic (short for information graphic) is a type of picture that blends data with design, helping individuals and organizations concisely communicate messages to their audience. More formally, an infographic is defined as a visualization of data or ideas that tries to convey complex information to an audience in a manner that can be quickly consumed and easily understood. The process of developing and publishing infographics is called data visualization, information design, or information architecture." (Smiciklas, 2012)
"Information graphics reveal the hidden, explain the complex and illuminate the obscure. Constructing visual representation of information is not mere translation of what can be read to what can be seen. It entails filtering the information, establishing relationships, discerning patterns and representing them in a manner that enables a consumer of that information construct meaningful knowledge. In the attention scarce world of today, information graphics (or infographics) have taken the media and communications industries by storm. From simple instructions on how to assemble your table, to explaining how a conjoined set of twins were surgically separated, to understanding what went wrong in the Challenger Shuttle disaster - designers, educators, journalists, and communicators in general have embraced infographics to help audience understand their intent in a swifter and smarter way." (Rajamanickam, 2005)
"Infographics are traditionally viewed as visual elements such as charts, maps, or diagrams that aid comprehension of a given text-based content. Thus, a newspaper infographic on a breaking news accident is expected to faithfully record, using visuals, what has been explained in the accompanying text. However, representation of information can be more than just the manner in which we are able to record what has been discovered by other means" (Rajamanickam, 2005)